> ## Documentation Index
> Fetch the complete documentation index at: https://docs.rntor.com/docs/llms.txt
> Use this file to discover all available pages before exploring further.
# Dashboards
> Track your space statistics with analytics dashboards for each module
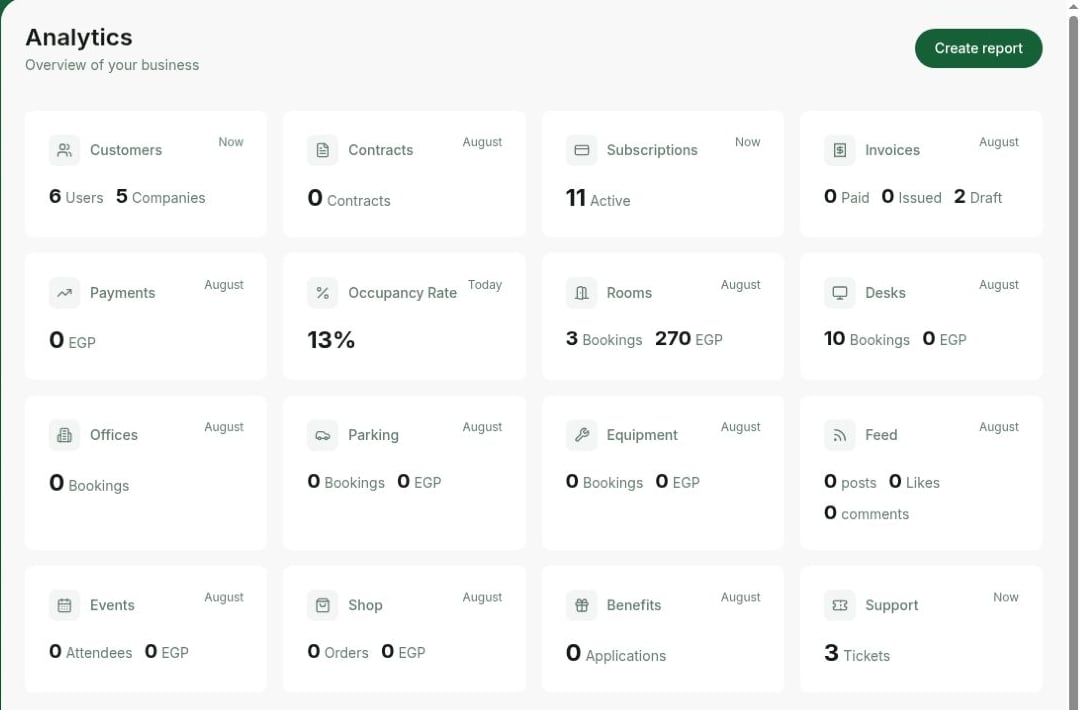
The **Analytics** page serves as a comprehensive dashboard that provides key performance indicators and metrics for your workspace. This powerful tool enables tracking and analyzing important data points such as invoices, volume, bookings, and much more.
## View Analytics
1. Go to RNTOR > **Analytics** page.
2. Get a quick overview of all dashboards for the current month's data.
 ## Analytics overview
By digging into each dashboard, you can get a consolidated view of the following statistics:
* **Customers**: provides the number of individual users and companies within your workspace community.
* **Contracts**: shows the quantity of the contracts of different statuses within different periods of time (a week, a month, half a year, or a year).
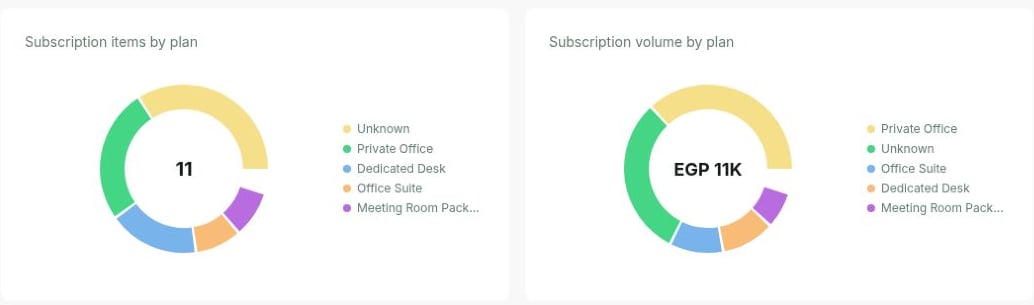
* **Subscriptions**: gives the number of customers with active subscriptions and identifies popular subscription periods; provides statistics on the number of subscriptions for different products (plans and resources), as well as revenue from subscriptions to each product.
## Analytics overview
By digging into each dashboard, you can get a consolidated view of the following statistics:
* **Customers**: provides the number of individual users and companies within your workspace community.
* **Contracts**: shows the quantity of the contracts of different statuses within different periods of time (a week, a month, half a year, or a year).
* **Subscriptions**: gives the number of customers with active subscriptions and identifies popular subscription periods; provides statistics on the number of subscriptions for different products (plans and resources), as well as revenue from subscriptions to each product.
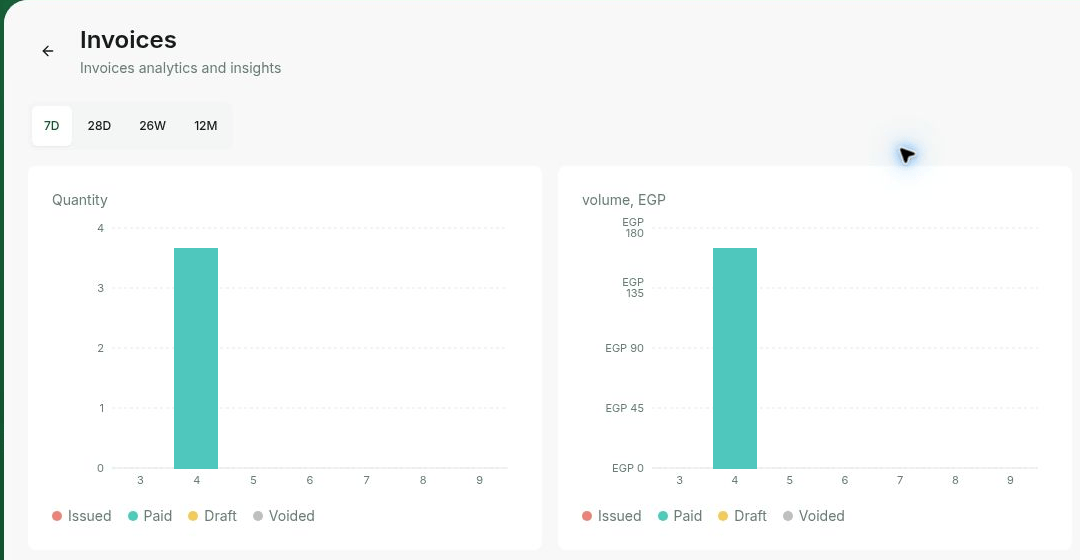
 * **Invoices**: shows the quantity and volume of the invoices of different statuses within different periods of time (a week, a month, half a year, or a year).
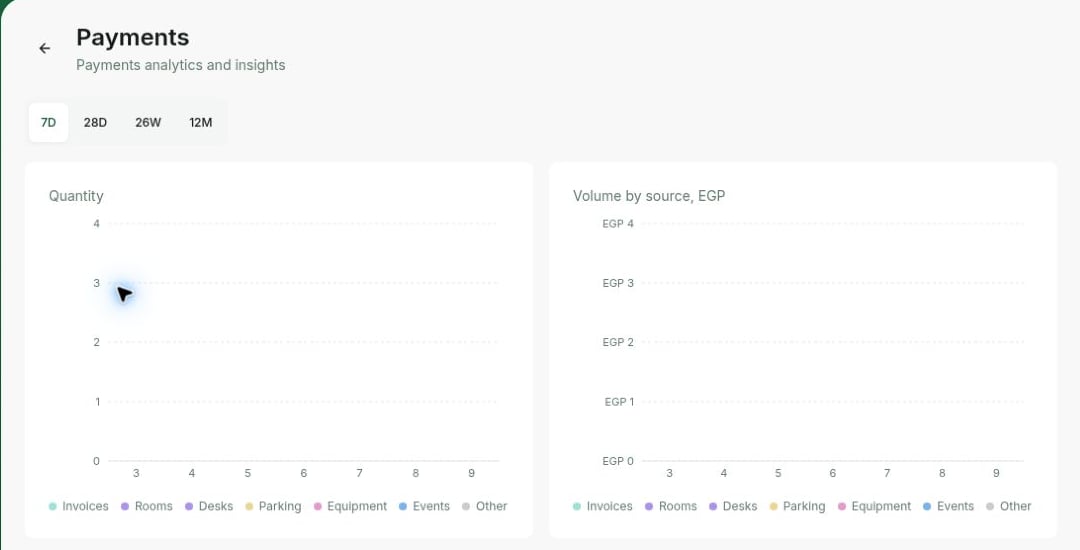
 * **Payments**: gives detailed statistics on the payments made for each resource you offer during a selected period (a week, a month, half a year, or a year).
 * [**Occupancy**](/docs/admin/analytics-reports/track-occupancy): displays the real-time overall occupancy rate of your space and the occupancy rate for each resource type.
* **Bookings**: provides insights into the number of bookings for each resource type, statistics by payment method, and volume generated from bookings during a selected period (a week, a month, half a year, or a year).
* **Feed**: showcases statistics on posts, likes, and comments, and provides a graphical representation of activity trends during a selected time period (a week, a month, half a year, or a year).
* **Events**: provides insights into attendees by payment method and displays the overall volume generated during a selected time period (a week, a month, half a year, or a year).
* **Shop**: offers information on orders made by payment method, the overall volume gained during a selected time period (a week, a month, half a year, or a year), and provides information on orders by status.
* **Benefits**: quantifies the number of benefits and applications during a selected time period (a week, a month, half a year, or a year).
* **Visitors**: offers insights into visits by type, and requests by status with the graphical representations of these data points during a selected time period (a week, a month, half a year, or a year).
* **Support**: allows you to track tickets by type and status during a selected time period (a week, a month, half a year, or a year).
Use the date range and granularity filters to compare data across different periods.
## Export data from Analytics
For a deeper analysis, you can export the data and tailor it to your specific needs with [custom reports](/docs/admin/analytics-reports/reports).
**FAQ**
The best way to track usage is by regularly visiting the **Analytics** page. This page provides valuable insights into the number of bookings and payments, allowing you to monitor usage patterns and trends over time. By reviewing the data on the **Analytics** page, you can gain a comprehensive understanding of how your users are utilizing your space. This information can help you make informed decisions and identify areas for improvement or optimization.
* [**Occupancy**](/docs/admin/analytics-reports/track-occupancy): displays the real-time overall occupancy rate of your space and the occupancy rate for each resource type.
* **Bookings**: provides insights into the number of bookings for each resource type, statistics by payment method, and volume generated from bookings during a selected period (a week, a month, half a year, or a year).
* **Feed**: showcases statistics on posts, likes, and comments, and provides a graphical representation of activity trends during a selected time period (a week, a month, half a year, or a year).
* **Events**: provides insights into attendees by payment method and displays the overall volume generated during a selected time period (a week, a month, half a year, or a year).
* **Shop**: offers information on orders made by payment method, the overall volume gained during a selected time period (a week, a month, half a year, or a year), and provides information on orders by status.
* **Benefits**: quantifies the number of benefits and applications during a selected time period (a week, a month, half a year, or a year).
* **Visitors**: offers insights into visits by type, and requests by status with the graphical representations of these data points during a selected time period (a week, a month, half a year, or a year).
* **Support**: allows you to track tickets by type and status during a selected time period (a week, a month, half a year, or a year).
Use the date range and granularity filters to compare data across different periods.
## Export data from Analytics
For a deeper analysis, you can export the data and tailor it to your specific needs with [custom reports](/docs/admin/analytics-reports/reports).
**FAQ**
The best way to track usage is by regularly visiting the **Analytics** page. This page provides valuable insights into the number of bookings and payments, allowing you to monitor usage patterns and trends over time. By reviewing the data on the **Analytics** page, you can gain a comprehensive understanding of how your users are utilizing your space. This information can help you make informed decisions and identify areas for improvement or optimization.